Do you mountain bike? Are you interested in data science? Do you think about weather data a lot? If you said “yes” to one of these questions, then keep reading to learn more! Don’t care about the story and want to jump right to the most recent Cincinnati MTB Trail Status predictions? You will find the most recent forecast on the top right tab “Cincinnati MTB Trail Forecast”.
When Can I Ride? Project Background
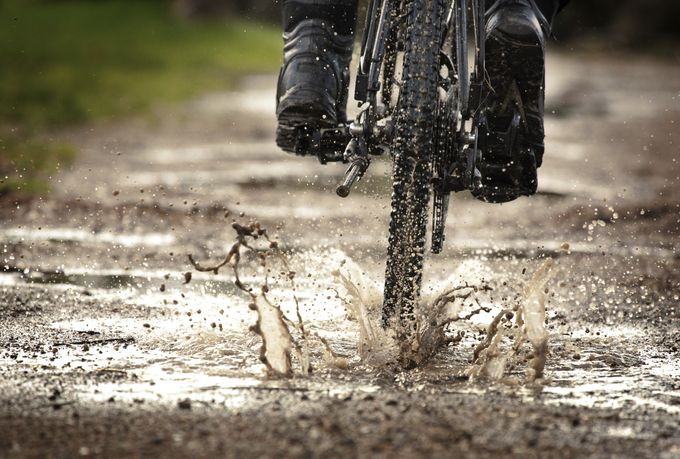
It’s late on a Thursday afternoon at work, you’re losing steam on your work project and your thoughts are starting to drift towards the weekend. You’ve just gotten yourself a new full-suspension mountain bike, and you can’t wait to try it out. But, when can I ride?
“Well it rained yesterday, but it will be dry tomorrow, but then my favorite trail doesn’t dry out very fast… Will the trails be open Saturday? Ahhh I don’t know, I guess I’ll have to wait and see“

This exact scenario is what led me to take on this project. In the past few months, I’ve built a Trail Status Predictor that serves as a forecasting tool to see if my local Cincinnati Mountain Biking trails will be open or not. I wanted a tool where I could better plan my weekday and weekend rides for myself and/or with friends. So far, it’s been a pretty good tool for me.
First Off: Why do mountain bike trails close?
Environmental Protection
- Soil Erosion: Wet soil is more susceptible to erosion. When bikers ride on wet trails, the tires can displace soil and create ruts.
- Vegetation Damage: Riding on wet trails can damage root systems and disturb local flora.
Safety Concerns
- Slippery Surfaces: Wet conditions can make trails slippery, increasing the risk of accidents.
- Poor Visibility: Wet weather can also result in foggy conditions, further compromising safety.
Experience
- Less Enjoyable: Riding on a muddy trail is often less enjoyable, as handling and control are compromised.
- Accessibility: Some trails have wooden features or bridges that become slippery and dangerous when wet.
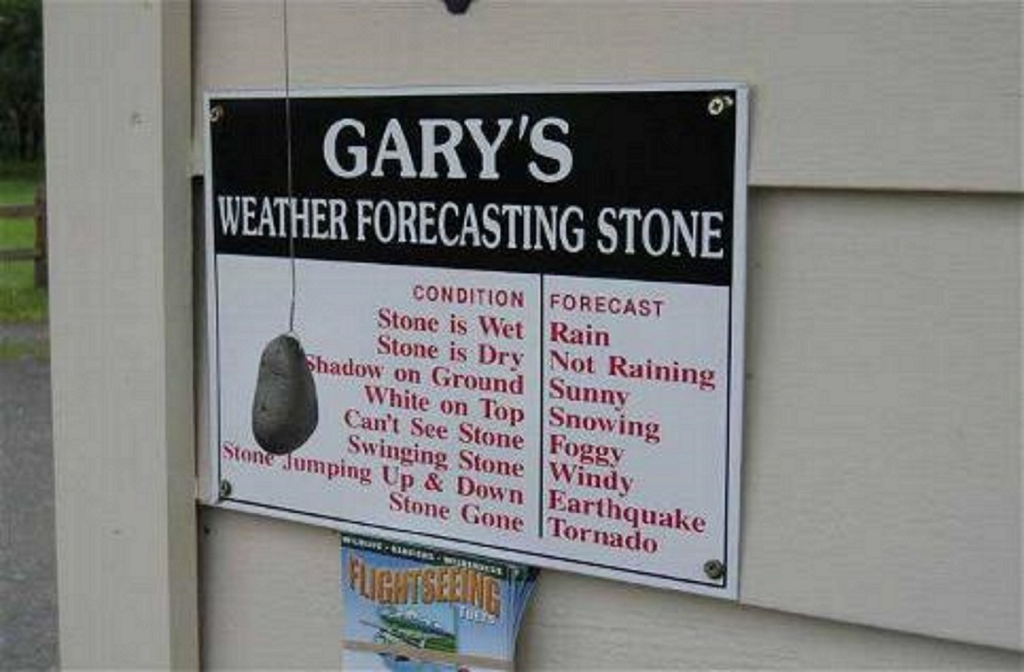
Deciding if a trail should be open or closed is complex, especially when you can’t see the conditions firsthand. Wet weather brings a slew of issues that force trail closures—let’s dive into why. Consider the below “day of” factors:
- How much did it rain today? Yesterday? The past week? Is it wet enough that bikers would cause erosion if they biked?
- What’s the air temperature? The wind? How fast will the moisture dry out?
- What trail are you riding? What’s the soil composition? How much sun does the trail get?
- And more ..
Trail readiness isn’t straightforward; it involves a lot of factors. That’s where local trail stewards come in, as they’re the experts on their trails. Ultimately, they are going to have the best “day of” Open/Closed trail classifications.
But what if we did want to try and predict if a trail was going to be open ahead of time? Let’s now consider the problem again:
- How much is it going to rain tomorrow? What’s the likelihood of that rain coming?
- Did it rain yesterday? Was it hot/dry yesterday, so that yesterday’s rain already dried up? What time of day is it going to rain tomorrow? What about the day after?
- What trail are you riding? Is that trail going to get rained on, but that rain is going to miss this other trail?
Predicting trail readiness isn’t just complex—it’s a moving target with numerous variables. But, we’re going to try it anyways!
Next: Project Objectives and Limitations
My objective for this project was to find reasonably accurate predictions for the Open/Close status of each trail for the week up ahead. I decided to constrain my predictions to Daily predictions, where I take the last trail status update of the day as my Daily data point (e.g. if a Trail is closed till 3PM but open at 11:59PM, I’m going to call it “Open”).
Some known limitations going into this project include that the training data I’m using is not perfect. There could easily have been a day in 2021 or 2022 where it rained a lot but a Trail Steward was out of town, or sick, and did not get the chance to update their respective Trail Facebook Page by the end of that day (source of truth for the CORA data). This kind of data will confuse the model and make it less confident when looking at future days with similar weather patterns, where the trails should probably be closed.
One other key limitation is that the project relies on forecasted weather data, which isn’t as reliable as historical data. We all know weather forecasts aren’t the most accurate (especially in a moody/rainy river valley like Cincinnati), so a prediction is extremely sensitive to any errors in the weather forecast.
For now, I’ve opted for simplicity by using Cincinnati’s Lunken Airport NOAA weather data (strong data availability through NOAA), though this could be refined in the future. This is obviously a somewhat flawed approach as the West side of Cincinnati could easily see different weather patterns than the East side of Cincinnati, but I’m reserving making this code upgrade for another time.
Alright, now that we’ve addressed our goal of finding “reasonably accurate Daily Open/Close Predictions” for each Cincinnati Mountain Bike Trail, let’s dive into the Data and Tools & Technologies.
Optional Glossary Before Diving In
Glossary for anyone less familiar with Machine Learning (ML). Feel free to skip if already well-versed in this field.
XGBoost – a machine learning algorithm known for its efficiency and accuracy. By employing gradient boosting frameworks, it can handle a variety of data types and predict complex outcomes, like trail conditions, by considering multiple weather factors.
Log Loss – a performance metric used to evaluate the accuracy of probabilistic predictions made by machine learning models like XGBoost. Lower values indicate that the model is making better probabilistic forecasts, making it especially useful when the outcomes are not strictly binary but have a level of uncertainty.
SHAP – tool for model interpretability, SHAP values help us understand the impact of each feature on the model’s output. It quantifies how much each weather variable (e.g., rainfall, temperature) contributes to each prediction, thereby offering insights into what drives the model’s decisions.
Amazon S3 / Lambda / Sagemaker – these are integrated cloud solutions for storing data, automating tasks, and refining machine learning models. S3 offers scalable storage, Lambda enables automated code execution, and Sagemaker provides a platform for machine learning model development.
Data, Tools, and Technologies
Tools Used:
- Python – to code
- XGBoost – to build the model
- Amazon S3 – to write out results and display on this blog
Data Sources Used:
- National Oceanic and Atmospheric Administration (NOAA) – 3 Years of Historical Cincinnati Weather Data
- OpenWeather One Call API 3.0 – Rolling last 1 week and future 1 week weather data & forecast
- CORA – Historical Trail Status (3 years)
I’m a Python guy so defaulting to using Python in VSCode locally on my Mac was a natural choice. If I had access to something like Amazon Sagemaker or another Cloud Service like such (that was a FREE tier), I likely would have done this project their for automation purposes, which we will get into later.
I was pleasantly surprised by NOAA’s free weather data, despite its outdated web portal. Although OpenWeather required a credit card to sign up for their One Call API 3.0, it’s actually free up to a certain usage limit. I’ve set an API cap to avoid exceeding this. While the API has been technically reliable, the forecast quality seems a bit off when compared to other sources like the Weather Channel.
For modeling, I chose to go with XGBoost. I’m not expert enough in ML to tell you why I chose XGBoost over other modeling choices, but I have just found that I’m familiar enough with XGBoost and the Data Science community continues to positively review XGBoost as a modeling tool, so I chose it. Just picking XGBoost as my “old reliable”, is it humility, naivety, or a little bit of both? I’ll let you decide.
Finally, for writing outputs and sharing them publicly (this blog), I went with Amazon S3. I found S3 to be super easy when it came to writing out to a bucket and then linking the live image to the blog. The trickiest part was configuring the S3 bucket permissions to make them publicly viewable / readable by WordPress. It’s important that you don’t have any sensitive information (e.g. API Keys) if you’re going to do this though.
The Methodology: Data to Insight
Finally, the good stuff (depending on your interests). Here’s how the code is put together:
Data Preprocessing
- 01_mtb_prep_data.py
- Weather Data Collection: The code employs an API to collect historical weather data, such as maximum temperature, wind speed, and total precipitation, for Cincinnati, Ohio.
- Data Caching: To speed things up and not waste resources, the code has a built-in “memory.” If it already has the data for today, it simply retrieves it from a saved file rather than calling the API again. This was primarily useful when developing the code and re-running the script many times per day to help avoid unnecessary API hits/expenses, but once things are smooth and automated, this could potentially be removed.
- Data Merging and Cleanup: The script merges several sources of weather data—historical, forecasted, and current—into one comprehensive file. The script also calculates a number of rolling or cumulative features. At the moment, it calculates Last 5, 3, 2 day metrics for PRCP and TMAX. This will help us better understand not just PRCP for that day or the day before, but how its accumulated over a week’s time. TMAX is used here as I found that it was more useful than TAVG (Temperature Avg) when trying to understand how fast a trail might dry out or not.
- Future Forecasting: Finally, the code prepares the data for future weather predictions. It organizes the data in such a way that it’s ready to make future forecasts.
Model Building and Evaluation
- 02_mtb_build_model.py
- Mountain Bike Trail Prediction: This code aims to predict the condition of all the local Cincinnati CORA mountain biking trails. Using XGBoost optimzied off of LogLoss, it tries to produce the best probablistic % estimate for each trail and minimize error with its forecast. This approach diverges from conventional machine learning problems, which often yield binary True/False outcomes. I chose a probabilistic output to give riders the benefit of understanding the uncertainty of each prediction, and because its natural when dealing with weather data to gravitate towards a probablistic outcome anyways (e.g. 30% chance of rain tomorrow).
- Model Training: The code customizes a unique machine learning model for each trail, taking into account its specific historical data. This ensures the forecasts are as accurate as possible for each individual trail, as each trail has many distinctive features that allow them to be open on some days when the other trails are not, and vice versa.
- Model Interpretability: The models employ SHAP (SHapley Additive exPlanations) to help understand which variables are most influential in the model’s predictions. We will see some of the SHAP charts for a few of the trails later in this post.
- Performance Metrics & Storage: Once the models are trained, the code measures their accuracy using Log Loss. It then saves these metrics and the models themselves, making it easy to deploy these models for future predictions. This part of the automated process is an optional step, the model is not “retrained” every day. Just when there is a new idea to try and improve performance, or if we started collecting more data in the future, when more data was present.
Make Predictions and Publish
- 03_make_preds.py & 04_visualize.py
- Weather Data Loading: The code begins by loading the dataset that contains historical and forecasted weather conditions for the trails from script 01. This serves as the foundation for future predictions.
- Machine Learning Models: The XGBoost models for each trail are loaded. These models will predict the probability that a trail is likely to be open or closed based on the weather data.
- Prediction and Record-keeping: The code then makes future predictions for each trail and stores these, along with the date of prediction, into a CSV file for record-keeping.
- Visualization and Cloud Upload: Finally, the predictions are visualized in a heatmap format and this visualization is uploaded to an Amazon S3 bucket for easy sharing and accessibility.
Make It Easy to Update
- run_all.py
- This Python script runs a series of other Python scripts in sequence to manage a data pipeline. Additionally, it checks if “run_model” is passed as a command-line argument. If it is, the script to build the model (
02_mtb_build_model.py) is inserted into the run sequence.
Project Results and Interpretation
**NOTE: These are live image links to the most up to date version of the model. If improvements are made over time, these images will change. So, keeping the interpretation of results to be less focused on the specific results and more at high level trends.
Model Accuracy By Trail
For this prediction problem, the model was optimized and scored on log loss. The model’s hyperparameters are also optimized by Log Loss, and use Random Grid Search to do so. Since I’ve chosen a probabilistic route for this project, as opposed to a 1/0 binary classifier, log loss is the best metric for the job of optimizing our model and also evaluating the probabilistic predictions.
When interpreting log loss model evaluations, the lower the better. So, here’s a look at how each trail’s model is performing.

Various factors can influence why one trail’s model outperforms another. One trail could have a more unpredictable drying pattern, or tend to have more nuanced weather systems in the area. Some trails could have been closed for extended periods of time in the model training period, which confuse the model. Nevertheless, we do see that some of the trails show some promise of being reasonably accurate predictors as to if the trails are going to be open or not.
Feature Selection By Trail
Now that we’ve seen how overall model accuracy varies by trail, let’s take a look at how feature selection varies by trail.


Overall, we can see that each trail has its own unique character, drying patterns, and factors as to how likely it is for it to be open. As the trails evolve into the future, this will only continue to change.
Future Work and Improvements
- Currently, the system isn’t automated. I’m considering looking into AWS Sagemaker pricing to do so.
- If it hasn’t been updates on a certain day and you’d like to see upcoming predictions, feel free to email me at jacksonburton04@gmail.com and and I will do my best to update.
- I’m currently in the process of trying to automate this locally on my Mac, but not sure how reliable this will or will not be
- Also, I’ve tried AWS Lambda but ran into an issue using Pandas and Matplotlib within Lambda, as both of these packages alone exceed the maximum project size within Lambda
- We are only using one weather location to train and apply the model for the sake of simplicity. This will limit the model’s ability to understand more discrete weather happenings (e.g. it rains on the East side of Cincinnati but not the West Side). If time permits, my plan is to include data from more localized weather stations in future iterations.
- I would like to further consider and understand the impact of having cumulative weather features that overlap and are non-unique in the model together. For instance, should there be cumulative 2,3,5 day features? Should there just be day of and rolling 5 day features? How best to deal with these?
- One intriguing yet challenging addition could be incorporating real-time user feedback into the predictive models. This could create a more dynamic model that reacts to user-reported trail conditions and would also help improve accuracy over time.
From Mud to ML, We’ve Made It
In conclusion, I hope that you have found this article to be engaging in some fashion or form. I had a unique local problem and opportunity to solve that problem. I’m happy (for now) with the results of this project and have learned a lot about weather data, historical trail status conditions, and have made better mountain biking plans because of this project.
If you are a:
Local Cincinnati Mountain Biker: please provide feedback! Tell me about a positive use case you’ve had with the predictor, tell me about a time it didn’t work so well. How can I make this tool work better for you?
Technology/Data Enthusiast: what would you have done differently? Do you have any similar projects or ideas?
Casual Reader: what did you think of the article? What lingering questions do you still have?
Got an idea on how to take this project to the next level that wasn’t covered? Have a question for how part of it is working? Leave a comment below! And as a reminder,
you can find the Daily Trail Status Predictions on the blog here
you can find the full code that I used to make this project here
Thank you to CORA for providing the data to make this project possible, and for being an amazing local organization and supporting Cincinnati MTB riders like myself!
If you’d like to stay up to date on any future Off Road Analyst posts, sign up below!